O Google Analytics (GA) é uma ferramenta gratuita da Google que permite aceder a uma série de informações sobre o website.
It also presents information about visitors and what they do when they visit the site.
Thus, with this data it is possible to improve it, adjust its content and structure in order to achieve your online objective.
Que tipo de informação o Google Analytics fornece?

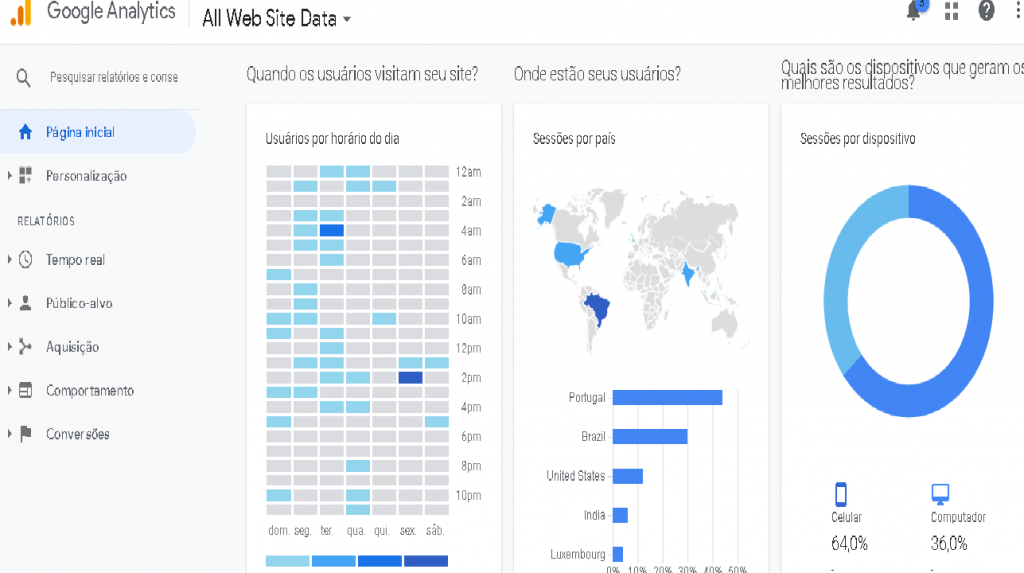
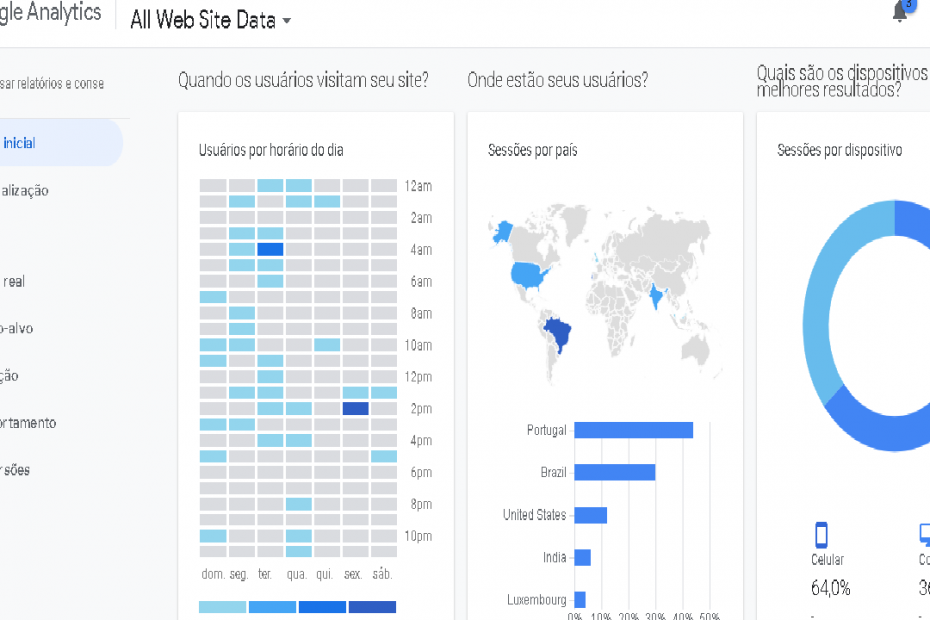
This image is part of the information generated by GA about my website.
However, there is more equally important information.
But for now, I will analyze these three groups of data.
And only with these 3 groups, it is possible to get some valuable information about my website.
First, let's see how this information is presented.
HOW IS GA INFORMATION PRESENTED?
As we can see, in a simple way, with graphs and percentages.
In the image, we can see 3 different graphs, easy to read, with percentage and brief description.
In the first graph, at what time of the day and throughout the week, people visited the website.
It turns out that Thursday, Friday and Saturday are the days with the fewest visits. From Sunday to Wednesday are the days with the most visits.
And yet, most people visited the website between midnight and 4 pm.
In the second group of data, most of the people who visited my website are in Portugal and Brazil. Other countries were the USA, India and Luxembourg.
In the graph on the far right, we see the devices used.
64% of people used their phone and 36% the computer.
In fact, this last graph confirms the trend to use of mobile phones over laptops to access websites.
HOW DO I INTERPRET GOOGLE ANALYTICS DATA? IS THIS INFORMATION EASY TO UNDERSTAND?

Only with this data, it is possible to get some ideas about my website.
For example, I find that my website is responsive because more than 60% of visitors are able to access the website via mobile phone. Which is great because it follows the trend of users.
If my online goal was to have a responsive website, I would have already achieved it!
On the other hand, if one of my goals was to increase the number of Brazilian visitors to my website, I would rely on the other two graphics as they would help me to plan, for example, an ad.
To do this, I would make an Google Ad or social media ad, for that country only, and I would be monitoring the data here in these graphs over time.
HOW CAN I USE GOOGLE ANALYTICS TO IMPROVE MY WEBSITE?
First of all, I will have to point out that it is important to gather more data and the same type of data over time.
This will allow a global and more sustained data to be able to focus and get the most of investment.
Through this sample, we can see the potential for useful information in order to improve the website.
Whoever has a website, knows how much it is necessary to maintain a “healthy” website, with excellent SEO and appearing on the first pages of Google search.
Google analytics, being free and for the information you provide, is an asset to achieve the above mentioned objectives.
That is why large companies have long used google analytics.
WHAT IF I DON'T HAVE TIME TO USE GOOGLE ANALYTICS?
Google Analytics has hundreds of different variables to analyze.
It is, in fact, an abysmal amount of data and can be very time consuming.
Fortunately, there is no need to study everything at once.
The most important thing is to know how to get the information relevant to your goals.
Need help getting Google analytics on your website?
To create a report ?
Would you like to plan strategies to enhance your website based on Google Analytics data?
Contact me using the contact icons on the right or click here

